
At the same time, in engineering studies and for manoeuvring simulator training often a constant wind direction and speed is used in the horizontal plane with a simple wind speed profile in the vertical direction. In dynamic mooring analysis an arbitrary, simplified wind spectrum is selected to describe the time variation of the wind speed.
Measurement campaign in major ports
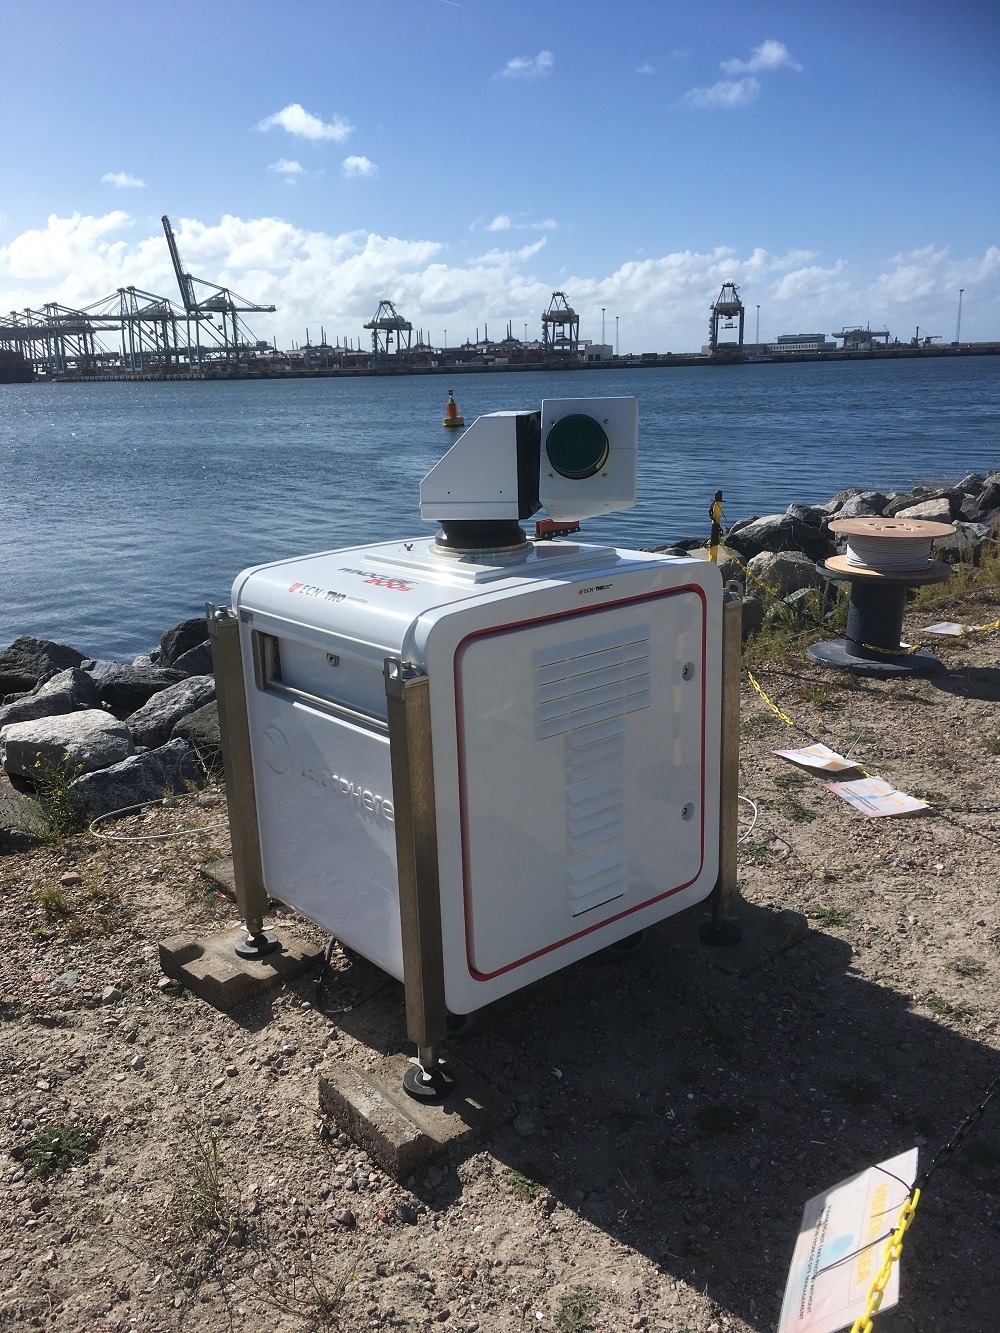
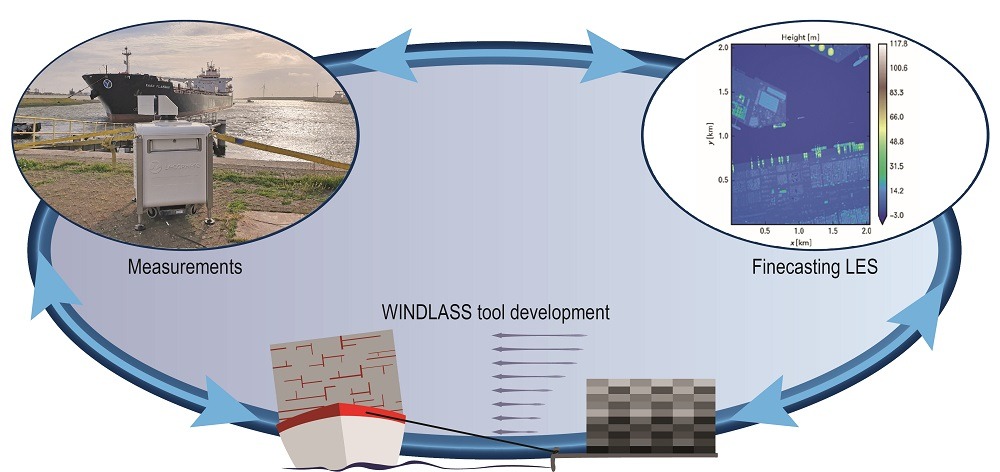
The WINDLASS JIP aims to understand and predict wind loads on high windage vessels in the port environment. An extensive measurement campaign is being conducted at eight locations in major ports such as Rotterdam, Hamburg and Antwerp. The measurements include 3D wind over a large area (up to 6 km) and are performed by deploying a Lidar wind scanner (see page 10). The vessel’s track and drift angle during manoeuvring and the motions while berthed are recorded by stereo cameras, as well as by Lidar systems. Mooring line tensions are measured by means of load cells. The measurement campaign is conducted during severe winds.
The measured wind is analysed and compared with the results of so-called ‘finecasting’; numerical simulation by LES CFD over the complete terminal area (10 x 10 km), using the global weather model as the boundary condition. The measured ship motions and mooring line tensions are compared with results from Dynamic Mooring Analysis (DMA).
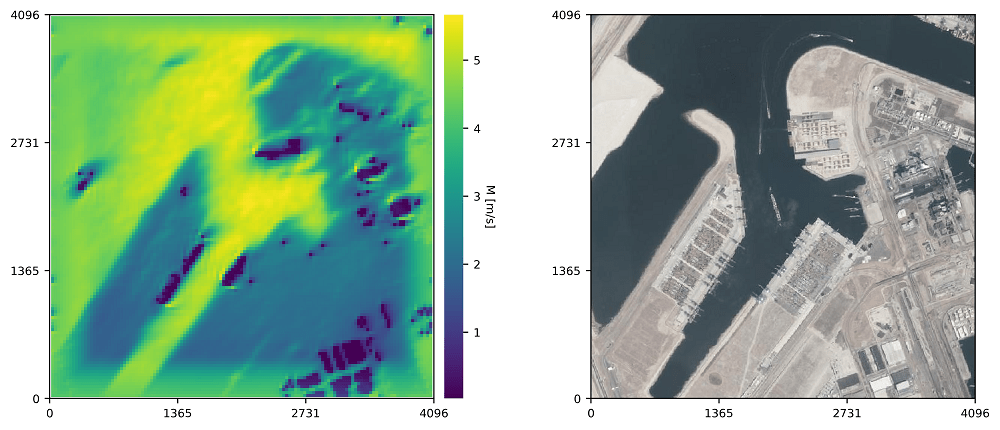
Finecast of the wind at container terminals in the Port of Rotterdam
Laptop tool developed
All measured and computed data is processed and analysed and results are delivered to the participating companies. The results of the Lidar wind scanner and the ‘finecasting’ method are used to derive a practical engineering model for the wind field at the terminal boundaries (2 x 2 km). This wind description model will provide a better input for engineering methods such as DMA.
Meanwhile, a computational tool has been developed to compute the wind loads on the ship, taking the neighbouring buildings, container stacks and other vessels within this 2 x 2 km into account, using the practical wind model as input. The tool is based on the WINDOS kernel software which is described in a separate article in this issue.
The characteristics of a variety of ship types and geometries of several port locations will be implemented in the tool. This laptop tool will be verified against the advanced analysis tools such as Finecast and DMA. Finally, it will then be delivered to all participating organisations for operational use by ports and terminals, vessel operators and pilots.
New participants welcome!
The WINDLASS JIP is conducted in close cooperation with 24 participating organisations including major port authorities, pilots, operators, classification societies, engineering contractors and R&D institutes.
WINDLASS started in 2019 and will be completed in 2022. Meetings are held in conjunction with the Vessel Operator Forum (www.vesseloperatorforum.com). New participants are still welcome to join!